Recently there has been criticism of too many ‘armchair epidemiologists’ creating confusion with misleading predictions. So apologies for this, but think there are some interesting nuances although I accept that projecting from existing data is always risky.
There has been so much discussion about the amount of testing and the spread of the virus, I thought that combining the testing data with predictive models based on the mortality rate data could provide some further insights. In addition, both the USA ( https://covid19.healthdata.org/projections ) and Province of Ontario (where I live) have recently released modeling predictions of cases and death tolls projected to April 15th and 30th.
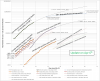
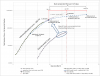
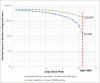
In the attached plot I have combined the Worldometer data from USA and Canada. The top 2 curves show the daily reporting of the number of cases in the US and the estimated spread of the virus based on the mortality count with my assumptions of a delay of 17 days and a mortality rate of 1%. The US projection of deaths assuming best case scenario from the healthdata.org site is shown by the dashed line on the top curve. The projection from the mortality rate derived curve seems to be in close agreement with the healthdata model output up until April 15th - you have to count back 17 days on the mortality based plot – to March 29th to account for my assumed delay between infection and death. It seems an aggressive target but let’s hope they’re right.
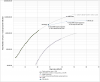
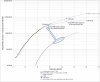
The Canadian data is presented in the bottom half of the graph. Up until now the Canadian government has not released any modeling results only Ontario.
The straight line end-points from their model projection are shown for no intervention and assumed effects due to current levels of intervention.
In both plots you can see the reducing LOG slope of the mortality-based and testing results curves with time. I’m not sure it’s all due to intervention measures as the flattening visually begins some days before March 20th when widespread measures were first introduced.
I varied the mortality rate of the Canadian curves to get an idea of the sensitivity. It doesn’t have an effect on the shape of the curve only the x-offset.
A final observation, it may be possible to evaluate the level of testing relative to the spread by comparing the shape of the test curve to the mortality-based curve. This would indicate significant under-test in the US during the early days of the outbreak (as is widely reported) which has apparently improved recently as reflected by the better tracking of the curve shape. The high rate of positive test results in the US (currently about 22%) would be a concern. Canadian rates have remained relatively low (about 3%)
The WHO recommends that the rate of test positives should be kept below 10 – 12% in order to track the spread effectively.
I am sure the GT40 forum is not the best place to put up such an analysis but assume that you wouldn’t click on this thread unless you were interested in the virus discussions, and I know there are quite a few analytical guys on this forum. You can remove this post if you don't think it's appropriate
There has been so much discussion about the amount of testing and the spread of the virus, I thought that combining the testing data with predictive models based on the mortality rate data could provide some further insights. In addition, both the USA ( https://covid19.healthdata.org/projections ) and Province of Ontario (where I live) have recently released modeling predictions of cases and death tolls projected to April 15th and 30th.
In the attached plot I have combined the Worldometer data from USA and Canada. The top 2 curves show the daily reporting of the number of cases in the US and the estimated spread of the virus based on the mortality count with my assumptions of a delay of 17 days and a mortality rate of 1%. The US projection of deaths assuming best case scenario from the healthdata.org site is shown by the dashed line on the top curve. The projection from the mortality rate derived curve seems to be in close agreement with the healthdata model output up until April 15th - you have to count back 17 days on the mortality based plot – to March 29th to account for my assumed delay between infection and death. It seems an aggressive target but let’s hope they’re right.
The Canadian data is presented in the bottom half of the graph. Up until now the Canadian government has not released any modeling results only Ontario.
The straight line end-points from their model projection are shown for no intervention and assumed effects due to current levels of intervention.
In both plots you can see the reducing LOG slope of the mortality-based and testing results curves with time. I’m not sure it’s all due to intervention measures as the flattening visually begins some days before March 20th when widespread measures were first introduced.
I varied the mortality rate of the Canadian curves to get an idea of the sensitivity. It doesn’t have an effect on the shape of the curve only the x-offset.
A final observation, it may be possible to evaluate the level of testing relative to the spread by comparing the shape of the test curve to the mortality-based curve. This would indicate significant under-test in the US during the early days of the outbreak (as is widely reported) which has apparently improved recently as reflected by the better tracking of the curve shape. The high rate of positive test results in the US (currently about 22%) would be a concern. Canadian rates have remained relatively low (about 3%)
The WHO recommends that the rate of test positives should be kept below 10 – 12% in order to track the spread effectively.
I am sure the GT40 forum is not the best place to put up such an analysis but assume that you wouldn’t click on this thread unless you were interested in the virus discussions, and I know there are quite a few analytical guys on this forum. You can remove this post if you don't think it's appropriate