
You are using an out of date browser. It may not display this or other websites correctly.
You should upgrade or use an alternative browser.
You should upgrade or use an alternative browser.
Coronavirus - Excellent Data-Based Analysis
- Thread starter sswartz
- Start date
Again - As the rules change around reporting, we may be seeing more of reality than we did before, therefore the curves will change - sometimes by a little - sometimes by a lot. That’s not a clear indication of a worsening or bettering of a problem.
Rules Changing around the count of Deaths example would be -
Changing the cause of death for someone to COVID-19 even though that person was never tested or diagnosed with the illness. This is now being routinely done retroactively for deaths as far back as 90 days when someone else in the deceased’s household has now been diagnosed with the illness.
Another change that we are now seeing is the test for the COVID-19 Antibodies in individuals which is being counted as a “positive” test as well as a positive in the “survivor” column.
—
These are only a couple of examples as to how the data is changing, therefore curves that span those changes can not be used reliably as a trend.
So while our ability to gather, quantify and report the data is getting better in some areas, other areas are lacking.
This doesn’t mean we should stop trying.
We need to enforce the same rules for data across the board with *all* countries reporting. If countries are not on-board with the data requirements, they need to be set aside and not grouped in with those that are reporting “properly”.
Can you send the links for the following data?
The number of deaths listed now because someone in the household was later diagnosed.
How many people have been administered the antibody test?
How many showed IGG or IGA positive results for covid-19?
How many of those are now counted in the positive test results?
Thanks
The number of deaths listed now because someone in the household was later diagnosed.
How many people have been administered the antibody test?
How many showed IGG or IGA positive results for covid-19?
How many of those are now counted in the positive test results?
Thanks
a 30 second search brings up some of the information you are looking for. I'm sure if you were to spend a little time looking you will find plenty more...
(Snippet)
Pneumonia and influenza deaths are included to provide context for understanding the completeness of COVID-19 mortality data and related trends. Deaths due to COVID-19 may be misclassified as pneumonia or influenza deaths in the absence of positive test results, and these conditions may appear on death certificates as a comorbid condition. Thus, increases in pneumonia or influenza deaths may be an indicator of excess COVID-19-related mortality. Additionally, estimates of completeness for influenza or pneumonia deaths may provide context for understanding the lag in reporting for COVID-19 deaths, as it is anticipated that these causes would have similar delays in reporting, processing, and coding. However, it is possible that reporting of COVID-19 mortality may be slower or faster than for other causes of death, and that the delay may change over time. Analyses to better understand and quantify reporting delays for COVID-19 deaths and related causes are underway. The list of causes provided in these tables may expand in future releases as more data are received, and other potentially comorbid conditions are determined.
(/Snippet)
We stand at 38,664 deaths in the US attributed to COVID. 55,642 died in 2017 from Influenza/Pneumonia. 647,557 died of Heart Disease in the same year. I am curious when we are on the other side of this what actual impact the virus had on the overall mortality rate of the country.
The current Covid 19 death totals are because of mitigation/social distancing. We'll never know how many would have died if the drastic measures were not taken.
Social distancing and stay and home orders wouldn't work for heart disease so they really can't be compared. Heart disease is preventable though since the leading causes are unhealthy diet, lack of exercise, being overweight and smoking. Most of those factors are a choice, being exposed to an airborne virus because people won't listen to the experts or because measures weren't taken early enough to prevent the spread aren't.
Social distancing and stay and home orders wouldn't work for heart disease so they really can't be compared. Heart disease is preventable though since the leading causes are unhealthy diet, lack of exercise, being overweight and smoking. Most of those factors are a choice, being exposed to an airborne virus because people won't listen to the experts or because measures weren't taken early enough to prevent the spread aren't.
Since the data we have strongly supports that the virus preys upon the oldest and also the unhealthiest of us I am hypothesizing that we may be trading what would be considered anything other then COVID deaths for COVID deaths. Comorbidity appears in the majority of the deaths. Sweden seems to be having success with their less draconian approach. The following is a more common sense approach in my opinion. https://davidkatzmd.com/wpcontent/uploads/2020/03/ravirs.katz_.3-22-20.pdf.The current Covid 19 death totals are because of mitigation/social distancing. We'll never know how many would have died if the drastic measures were not taken.
Social distancing and stay and home orders wouldn't work for heart disease so they really can't be compared. Heart disease is preventable though since the leading causes are unhealthy diet, lack of exercise, being overweight and smoking. Most of those factors are a choice, being exposed to an airborne virus because people won't listen to the experts or because measures weren't taken early enough to prevent the spread aren't.
Since the data we have strongly supports that the virus preys upon the oldest and also the unhealthiest of us I am hypothesizing that we may be trading what would be considered anything other then COVID deaths for COVID deaths. Comorbidity appears in the majority of the deaths. Sweden seems to be having success with their less draconian approach. The following is a more common sense approach in my opinion. https://davidkatzmd.com/wpcontent/uploads/2020/03/ravirs.katz_.3-22-20.pdf.
My link got messed up, this should be the correct link.
Coronavirus: Information and Resources – David L. Katz
 davidkatzmd.com
again - as I pointed out in Post 103 above ---
Until all these countries you are comparing numbers with are all on the same data standard, throw any comparisons and trends out the window as they are next to meaningless..
We need to enforce the same rules for data across the board with *all* countries reporting. If countries are not on-board with the data requirements, they need to be set aside and not grouped in with those that are reporting “properly”.
Until all these countries you are comparing numbers with are all on the same data standard, throw any comparisons and trends out the window as they are next to meaningless..
again - as I pointed out in Post 103 above ---
Until all these countries you are comparing numbers with are all on the same data standard, throw any comparisons and trends out the window as they are next to meaningless..
and oddly enough - that is ONE area that the World Health Organization could actually help the situation!
Bill Kearley
Supporter
My brother inlaw is a paramedic and is in the position that he is afraid to go home to his family after his shift. This isn't exactly on topic on this thread but lets all pay attention and be diligent.
Ian Anderson
Lifetime Supporter
and oddly enough - that is ONE area that the World Health Organization could actually help the situation!
I have heard Zimbabwe has decided that they only had a couple of cases, however this year they have a rampant malaria outbreak that is causing lots of deaths. And it is strange this malaria comes with a cough and pneumonia
First responders and medical staff are in a tough spot no doubt. They do have to be concerned in all situations from the risk they have with being exposed to Hepatitis, HIV, etc.My brother inlaw is a paramedic and is in the position that he is afraid to go home to his family after his shift. This isn't exactly on topic on this thread but lets all pay attention and be diligent.
Update;
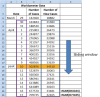
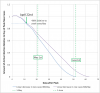
It’s now been 12 days since the peak in new cases/day (April 10th) so perhaps time for an update. The daily new positive test cases have been dropping but still remain high (~26k yesterday versus ~34k at peak). This corresponds to an average drop of roughly 750 cases/day. I have updated the model using the same approach as before; an 18 day sliding window incorporating the latest daily data plus two projected curves assuming linear decreases of 600 and 800 cases/day. Since the model attempts to derive active infection relative to the day of peak new cases (Apr 10th) based on the new cases/day data, a factor must be added to account for the average time between a person being infected and having a test. I have used 7 days; based on 5-6 days between infection and symptoms presenting plus 1-2 days before test/result. The results of the updated model are attached.
The model suggests that active infection level is currently above 85% of peak.
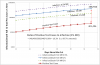
The other part of the problem I’ve being trying to model is the ratio of non-detected cases and an estimate of the extent of the absolute amount of infection based on combining the death toll and positive testing data. The flattening of both these curves has reduced one of the sources of errors inherent with this approach; the time offset between these two curves. I’ve also introduced a 5 day averaging window to reduce the ripple in the daily data. Based on this latest approach, the amount of undetected infection is about 90% (89.7%) compared to 88% previously estimated based on 1% mortality rate (MR) – see attached. As offset error of 1 day between the two curves now results in less than 1% change in ratio of undetected infection; i.e. 89.7% +/- 1%.
As discussed previously, there will remain a large uncertainty around the actual MR for some time to come, and therefore it is necessary to allow for this fact. As a working assumption, I assume that the MR will eventually fall somewhere between 2% and 0.5%. This equates to between 80% to 95% of the actual infection being untested so far.
Based on these latest results, the following can be observed:
It’s now been 12 days since the peak in new cases/day (April 10th) so perhaps time for an update. The daily new positive test cases have been dropping but still remain high (~26k yesterday versus ~34k at peak). This corresponds to an average drop of roughly 750 cases/day. I have updated the model using the same approach as before; an 18 day sliding window incorporating the latest daily data plus two projected curves assuming linear decreases of 600 and 800 cases/day. Since the model attempts to derive active infection relative to the day of peak new cases (Apr 10th) based on the new cases/day data, a factor must be added to account for the average time between a person being infected and having a test. I have used 7 days; based on 5-6 days between infection and symptoms presenting plus 1-2 days before test/result. The results of the updated model are attached.
The model suggests that active infection level is currently above 85% of peak.
The other part of the problem I’ve being trying to model is the ratio of non-detected cases and an estimate of the extent of the absolute amount of infection based on combining the death toll and positive testing data. The flattening of both these curves has reduced one of the sources of errors inherent with this approach; the time offset between these two curves. I’ve also introduced a 5 day averaging window to reduce the ripple in the daily data. Based on this latest approach, the amount of undetected infection is about 90% (89.7%) compared to 88% previously estimated based on 1% mortality rate (MR) – see attached. As offset error of 1 day between the two curves now results in less than 1% change in ratio of undetected infection; i.e. 89.7% +/- 1%.
As discussed previously, there will remain a large uncertainty around the actual MR for some time to come, and therefore it is necessary to allow for this fact. As a working assumption, I assume that the MR will eventually fall somewhere between 2% and 0.5%. This equates to between 80% to 95% of the actual infection being untested so far.
Based on these latest results, the following can be observed:
- current (as of Apr 22nd) level of active infection >85% of peak
- between 80 to 95% of infection is untested (corresponding to MR of between 2% and 0.5%)
- between 4.3 to 17 million people (1.3% to 5.3% of the total population) in the USA have already been infected (corresponding to MR between 2% and 0.5%)
- > 94% of USA population currently uninfected
Attachments
Trevor, >94% of the US population currently uninfected? What are thoughts on the new information that suggests many Americans have been infected by the virus but were asymptomatic or did not get treated or tested? (I actually think I might be in that category). Fair to conclude that the MR would be higher too. Unless we do massive testing of the population for the presence of antibodies we will never know for sure.
Yes, I noted an article that appeared yesterday suggesting possibly much wider spread:
 www.cnbc.com
There was in fact a similar possibility put forward by an Oxford University group a while ago. If true this would be good news (as it implies that the MR in fact would be lower that 0.5%). However, I think the only way to verify this would be widespread serology testing.
www.cnbc.com
There was in fact a similar possibility put forward by an Oxford University group a while ago. If true this would be good news (as it implies that the MR in fact would be lower that 0.5%). However, I think the only way to verify this would be widespread serology testing.
I hope this will be part part of the accelerated level of testing that is currently being discussed. If this does turn out to be true, then a key question will be how long do detected antibodies last in a person's blood for this new virus and what levels are required to avoid reinfection.
I don't think there is any way around it, much more widespread testing as well as multiple types of tests are essential to have any understanding of where we are. I know this is just repeating what the health officials keep saying, but you can see that without it, we are totally in the dark when it comes to any sugnificant reopening.
Antibody study suggests Covid-19 could be far more prevalent in the Bay Area than official numbers suggest
Researchers from Stanford University shared the results of a large-scale community test, and estimate that between 2.5% and 4.2% of the population of Santa Clara County may have antibodies.
I hope this will be part part of the accelerated level of testing that is currently being discussed. If this does turn out to be true, then a key question will be how long do detected antibodies last in a person's blood for this new virus and what levels are required to avoid reinfection.
I don't think there is any way around it, much more widespread testing as well as multiple types of tests are essential to have any understanding of where we are. I know this is just repeating what the health officials keep saying, but you can see that without it, we are totally in the dark when it comes to any sugnificant reopening.
My wording was not clear regarding the "MR" I really meant that the overall death count numbers may prove to be higher if the virus was killing people prior to us testing and it went unrecognized. Yes, the MR will prove to be lower if more folks had it and recovered as you correctly stated.Yes, I noted an article that appeared yesterday suggesting possibly much wider spread:
There was in fact a similar possibility put forward by an Oxford University group a while ago. If true this would be good news (as it implies that the MR in fact would be lower that 0.5%). However, I think the only way to verify this would be widespread serology testing.Antibody study suggests Covid-19 could be far more prevalent in the Bay Area than official numbers suggest
Researchers from Stanford University shared the results of a large-scale community test, and estimate that between 2.5% and 4.2% of the population of Santa Clara County may have antibodies.
I hope this will be part part of the accelerated level of testing that is currently being discussed. If this does turn out to be true, then a key question will be how long do detected antibodies last in a person's blood for this new virus and what levels are required to avoid reinfection.
I don't think there is any way around it, much more widespread testing as well as multiple types of tests are essential to have any understanding of where we are. I know this is just repeating what the health officials keep saying, but you can see that without it, we are totally in the dark when it comes to any sugnificant reopening.
Yes, one of the things I would be interested in with the Santa Clara research was the demographic breakdown of the population. I keep having to remind myself that the MR of the virus isn't carved in stone. It depends on the age/health breakdown of the 'target' population as well as the ethnic mix. These factors need to be accounted for when projecting to different/larger populations. I've a feeling that the IHME models include a lot of these factors.
Similar threads
- Replies
- 18
- Views
- 7K
- Replies
- 24
- Views
- 4K
- Replies
- 18
- Views
- 4K
- Replies
- 3
- Views
- 1K