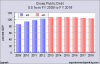
The red line is the debt during the Reagan BushI years. Cutting taxes and increasing defence spending blew the economy for generations to come!!

[/quote]
Jim,
Keep in mind that President Bush took office in January 2001 and his first budget took effect October 1, 2001 for the year ending September 30, 2002 (FY2002). So the $133.29billion deficit in the year ending September 2001 was Clinton's. Granted, Bush supported a tax refund where taxpayers received checks in 2001. However, the total amount refunded to taxpayers was only $38 billion . So even if we assume that $38 billion of the FY2001 deficit was due to Bush's tax refunds which were not part of Clinton's last budget, that still means that Clinton's last budget produced a deficit of 133.29 - 38 = $95.29 billion.
The federal budget is normally done annually. One has not been done since 1997 when the democratic party assumed control of the House. Your graph does not include any of the additional spending by the current administration. Compare the two... (see the attached image I can't seem to imbed)
If you access the CBO's "historic budget data" plugging in your chart's dates
Debt to the Penny (Daily History Search Application), on the first page you will see that 1998 shows a surplus of $69 billion, 1999 shows $126 billion, 2000 shows $236 billion--the same surpluses claimed by Clinton.
However, further analysis of the document should make it very clear that important information is missing from the CBO document--specifically focusing on the last two columns of the table on page 1. If you take the $3,772.3 billion debt held by the public at the end of 1997 and subtract the "total" $69.3 billion surplus stated for 1998, you would expect to see the debt go down by 69.3 billion to $3,703 billion. Instead, the debt indicated for 1998 is $3,721.1 billion--suggesting a surplus of only $51.2 billion. This alone should tell you that the CBO numbers aren't telling the whole story because they don't add up--and the story they aren't telling is intragovernmental holdings (Like IOUs to Social Security).
The bottom line is that the national debt going down as adjusted for inflation or as a percentage of GDP is a valid metric for evaluating the debt load of the government but it says nothing about whether or not there was a budget surplus or deficit. If the total national debt went up, there was a deficit. Those that think a decrease in the debt load of the federal government as a percentage of GDP or adjusted for inflation is equivalent to a same-year surplus don't understand the definitions and purposes of each of these terms. It's like saying I get great mileage and my socks are a size 10. They measure different things and while you may make conclusions about big feet using more accelerator, the comparison isn't very useful.
You can also get the same effect by lowering the GDP, not a good thing.

") They could then hit the home owners for some local area council taxes like we have here in England. I have to pay $16,800 a year for my place against the rates I pay on a farm I own in Oklahoma which is $135. How many trillions would that amount to.
They could then hit the home owners for some local area council taxes like we have here in England. I have to pay $16,800 a year for my place against the rates I pay on a farm I own in Oklahoma which is $135. How many trillions would that amount to.